Your Dashboard Shows What Happened. Can It Tell You What's Next?
A report can be accurate and useful while still leaving too many steps between what the data shows and what someone actually does next.
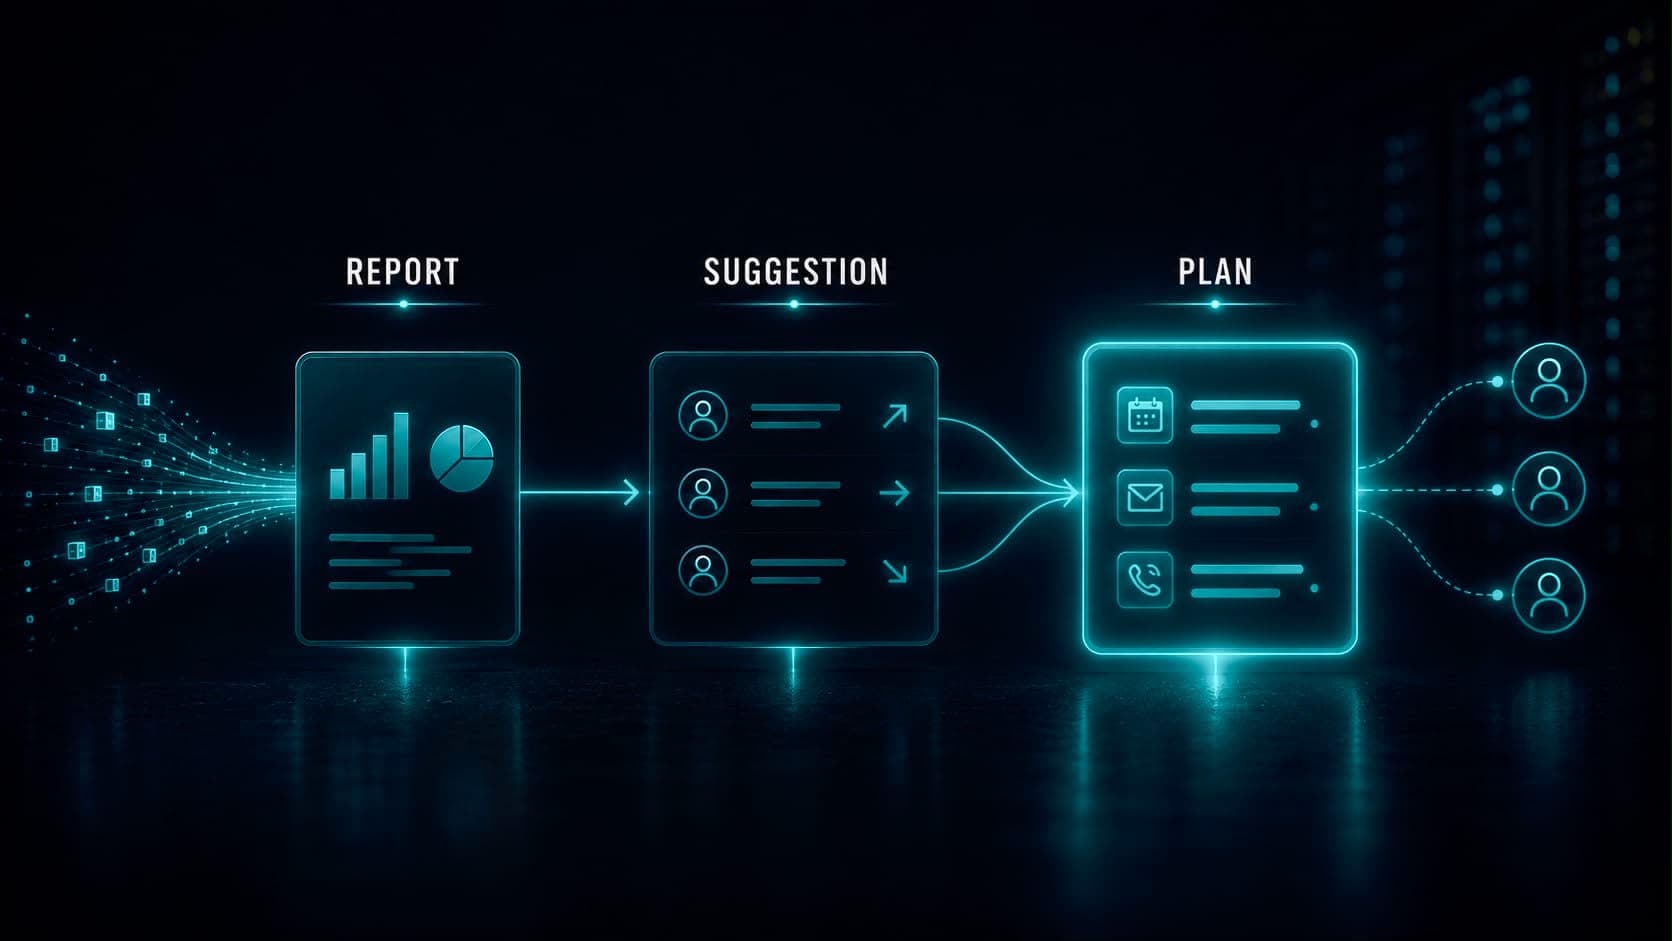
A report can be completely accurate and still fail to change the outcome. We saw this with one of our clients.
Their sales data was collected in a structured data system, where an AI tool analyzed patterns across the entire sales team - looking at behaviors associated with both stronger and weaker performance. Those patterns were then translated into plain business language and delivered to management as a report.
The report was accurate. But it quickly revealed an important distinction: a good report and a changed outcome are two different things.
The report answered one question: What happened? The business needed an answer to another: What should this person do next?
What Does a Dashboard Actually Tell You?
A traditional report is good at answering one question: "What happened?"
In this case, the data was structured, analyzed for patterns, and translated from technical information into something a sales manager could actually use. That was already a significant step beyond a basic dashboard.
The report showed what the data revealed. It identified patterns among high-performing sales representatives, highlighted where deals were breaking down, and showed which behaviors were associated with stronger results.
But the next question was more difficult: What should a specific person do differently tomorrow?
That requires a different level of information. Knowing that high performers behave in a certain way does not automatically tell a struggling representative which part of their own routine to change. The pattern exists at team level. The action has to make sense at individual level.
Where Does "Accurate" Stop Being Enough?
The report was correct. The patterns held up. What it lacked was a direct next step for each person.
A manager could see that certain behaviors were associated with better results. They still had to interpret those findings case by case:
- For one representative, the answer might involve changing how they approached calls.
- For another, it might mean adjusting how they followed up with prospects.
- A high performer needed a different kind of insight altogether: not correction, but an opportunity to improve an already effective routine.
This is where accuracy alone stops being enough. The more useful question becomes: How quickly can accurate information turn into a useful action?
A report can identify a pattern. Someone still has to decide what that pattern means for a particular person.
What Changes When a System Can Estimate What's Likely to Help Next?
A few months after the first version was implemented, enough additional data had accumulated to take the same analysis one step further. The question changed.
Instead of asking only: "What do our highest performers do differently?"
The system could ask: Based on those patterns, what could help this specific representative improve?
The answer became individual. Lower-performing representatives received specific suggestions based on behaviors associated with stronger results across the team. High performers received a different version: recommendations focused on optimization rather than correction.
The system had moved from describing a pattern to applying that pattern to an individual. It was no longer simply explaining what had happened across the sales organization. It was using historical patterns to estimate which actions could improve a specific person's results before their next set of calls.
What Does It Take to Turn Insight Into Action?
The project went one step further. The same patterns were connected to automated processes that generated daily plans for individual representatives. Those plans were built around the actions the data indicated were most likely to help that person on that day.
That created a clear progression: Data → Pattern → Individual recommendation → Daily plan
Each step reduced the amount of interpretation required from the person using the information:
- The first version told management what was happening.
- The second connected those patterns to specific people.
- The third turned the insight into a plan that could be used immediately.
Information creates business value when it helps someone make a decision or change what they do.
So: Your Dashboard Shows What Happened. Can It Tell You What's Next?
It can - but a dashboard alone rarely gets you there.
In this project, three different capabilities emerged: describing what happened, identifying what could improve the outcome, and turning that insight into the next action.
The report was accurate and useful. But it answered a question about what had happened, while the business needed an answer to a different question: what should happen next?
The important shift was from: "The data shows this." to "Here's what this person should do next."
Closing that gap required two more stages of development. Before expecting the next dashboard, report, or AI analysis to change an outcome, ask one question:
How many steps sit between what the data shows and what someone actually does next?
That distance is where reporting ends and decision support begins.
Related posts
Can Your Data Become a Revenue Stream?
Your data may be valuable because of what it contains. But its commercial value can also come from what it can reveal - without handing over the records themselves.
Read moreData & StrategyWhy Do Companies Still Make Decisions With Data They Don't Fully Trust?
Every system can appear correct on its own while the combined picture describes a very different reality. The question is which data can be trusted for a specific decision.
Read moreReady to automate your sales process?
Let's map your workflow and identify where automation creates the fastest measurable impact.
Book a Call